Regenerative Microclimate Scorecard, Marseille
Vieux-Port · ~800 m study area · baseline vs. tree-canopy intervention
AT6012
infrared.city SDK 0.4.9
UTCI · Wind · Solar
~800 m site
live API result
An enlarged Vieux-Port study area (~800 m, replacing the earlier ~290 m pilot) gives a far richer microclimate field for a proper case study. The same workflow runs three analyses over the block and compares a baseline against a tree-canopy intervention.
Workflow
6,347
buildings (context geometry)
2,194
trees (intervention layer)
~800 m
study area (≈24 tiles/scenario)
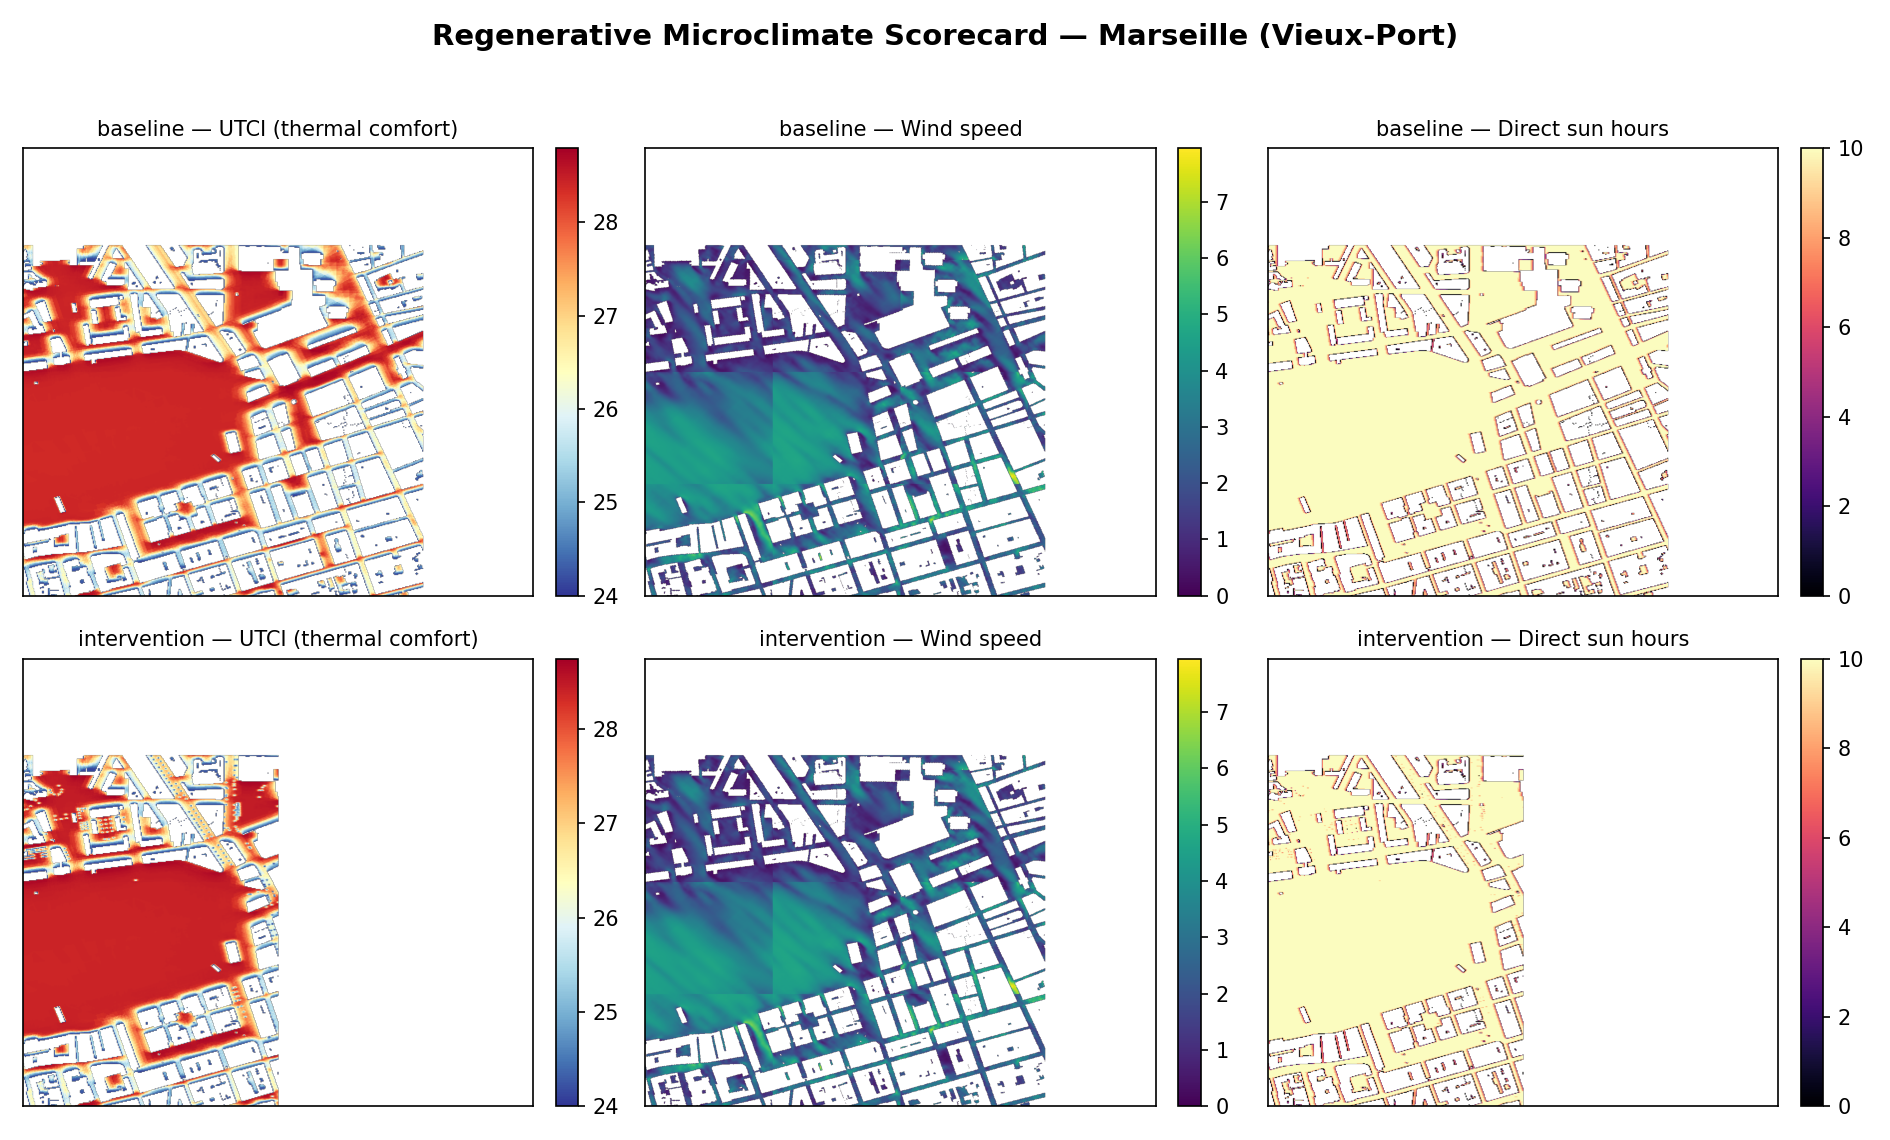
Thermal comfort (UTCI)
| Metric | Baseline | + Trees | Change |
|---|---|---|---|
| Mean UTCI | 27.3°C | 27.5°C | +0.2°C |
| Comfortable area (9,26°C) | 20.9% | 17.0% | −3.9 pts |
| Heat-stress area (UTCI>26°C) | 79.1% | 83.0% | +3.9 pts |
| Thermal-zone diversity (Shannon) | 1.03 | 0.94 | −8.7% |
A counterintuitive result, and why it matters. Over this larger, denser block the canopy
intervention raised modeled heat-stress area by 3.9 points rather than lowering it. Two factors explain it,
and both are good teaching points:
- Coverage shift (measurement artifact). Tree canopy masks cells out of the UTCI grid (the intervention panel resolves fewer cells), so the percentages are not computed over an identical cell set , the comparison is not strictly like-for-like.
- Plausible physics. In dense Mediterranean street canyons, canopy can reduce sky-view and ventilation, trapping daytime radiant heat, cooling is not guaranteed by simply adding trees.
Wind & Solar
| Metric | Baseline | + Trees |
|---|---|---|
| Mean wind speed | 2.65 m/s | 2.65 m/s |
| Mean direct sun hours | 9.14 h | 9.35 h |
Method
One run_area_and_wait() call per analysis over the ~800 m Vieux-Port polygon.
Buildings and weather are injected for all runs (thermal-comfort requires geometry); vegetation is injected only for the
intervention. Outputs are merged NumPy grids scored by regenerative_metrics.py
(UTCI bands, heat-stress %, Alberti assembly index). Weather: nearest EPW station
(Marseille-Provence AP TMYx).